Digital, a New “Drug”
Speed. It’s synonymous with the times. I often think we are living in the “Matrix”, remember Keanu Reeves ;-). Our physical world and digital world almost seem to be converging into one. How in the world do we do so much so fast and not loose quality. In fact the amount of information and quality of information we have access to is astounding. Think “infographics”.
Before the IG topic is opened up, let me finish my heightened thoughts of our brilliant world. Or you can quickly take a look at some of my favorites below since I’m getting too long-winded and philosophical here! I wouldn’t read this! But computers/devices are amazing – worshiped. We feel crippled when they are down, even for a minute. It took the universe, 4.54 billion years to reach this level of amazing, and to open up a new form of sharing information – Infographics will evolve like everything else but they are a “game-changer”.
As a efficiency-tool enthusiast, I love to find new tools that improve the amount of work I get done – faster, faster, faster, faster. I love to push the envelope of efficiency and quality. I’ve even been told I should have considered becoming an efficiency expert. My closet doesn’t agree, but you’ve heard the saying, “the cobblers kids always have holes in their shoes”. Proverbs weren’t my strong point either, I love them but never get one right. I looked this one up “The shoemakers son always goes barefoot”. Don’t expect me to do that again. You knew what I meant…
The tool that I use enjoy most today, is the infographic (data visualization). It speeds up my professional production line, not in the traditional way, but the foundation of my life’s work is data/information. Infographics get me there at mach-speed, giggling, smiling and smirking…all the way home. This tool doesn’t speed up workflow, it speeds up information input. Data in-Data out. Whether we are retrieving information already stored in our brains or supplementing with new bits, if we didn’t have the information, no work would get done – not in Marketing anyway. “Knowledge is King” and inundating at times! I bookmark, save, print out, add to my to-do list, but I rarely get back to 50% of the reports, articles, reviews, etc etc.
I have found that a good infographic can act as a terrific tool that allows us to inhale even more information, at mach speed, all while having fun taking in all the witty, colorful and sometime funny images and stories. I bet, one day half of our reading will be done through infographics. Reading page-for-page of information will become “old school”.
Infographic Research/Designers – Hardworking/Creative/Amazing!
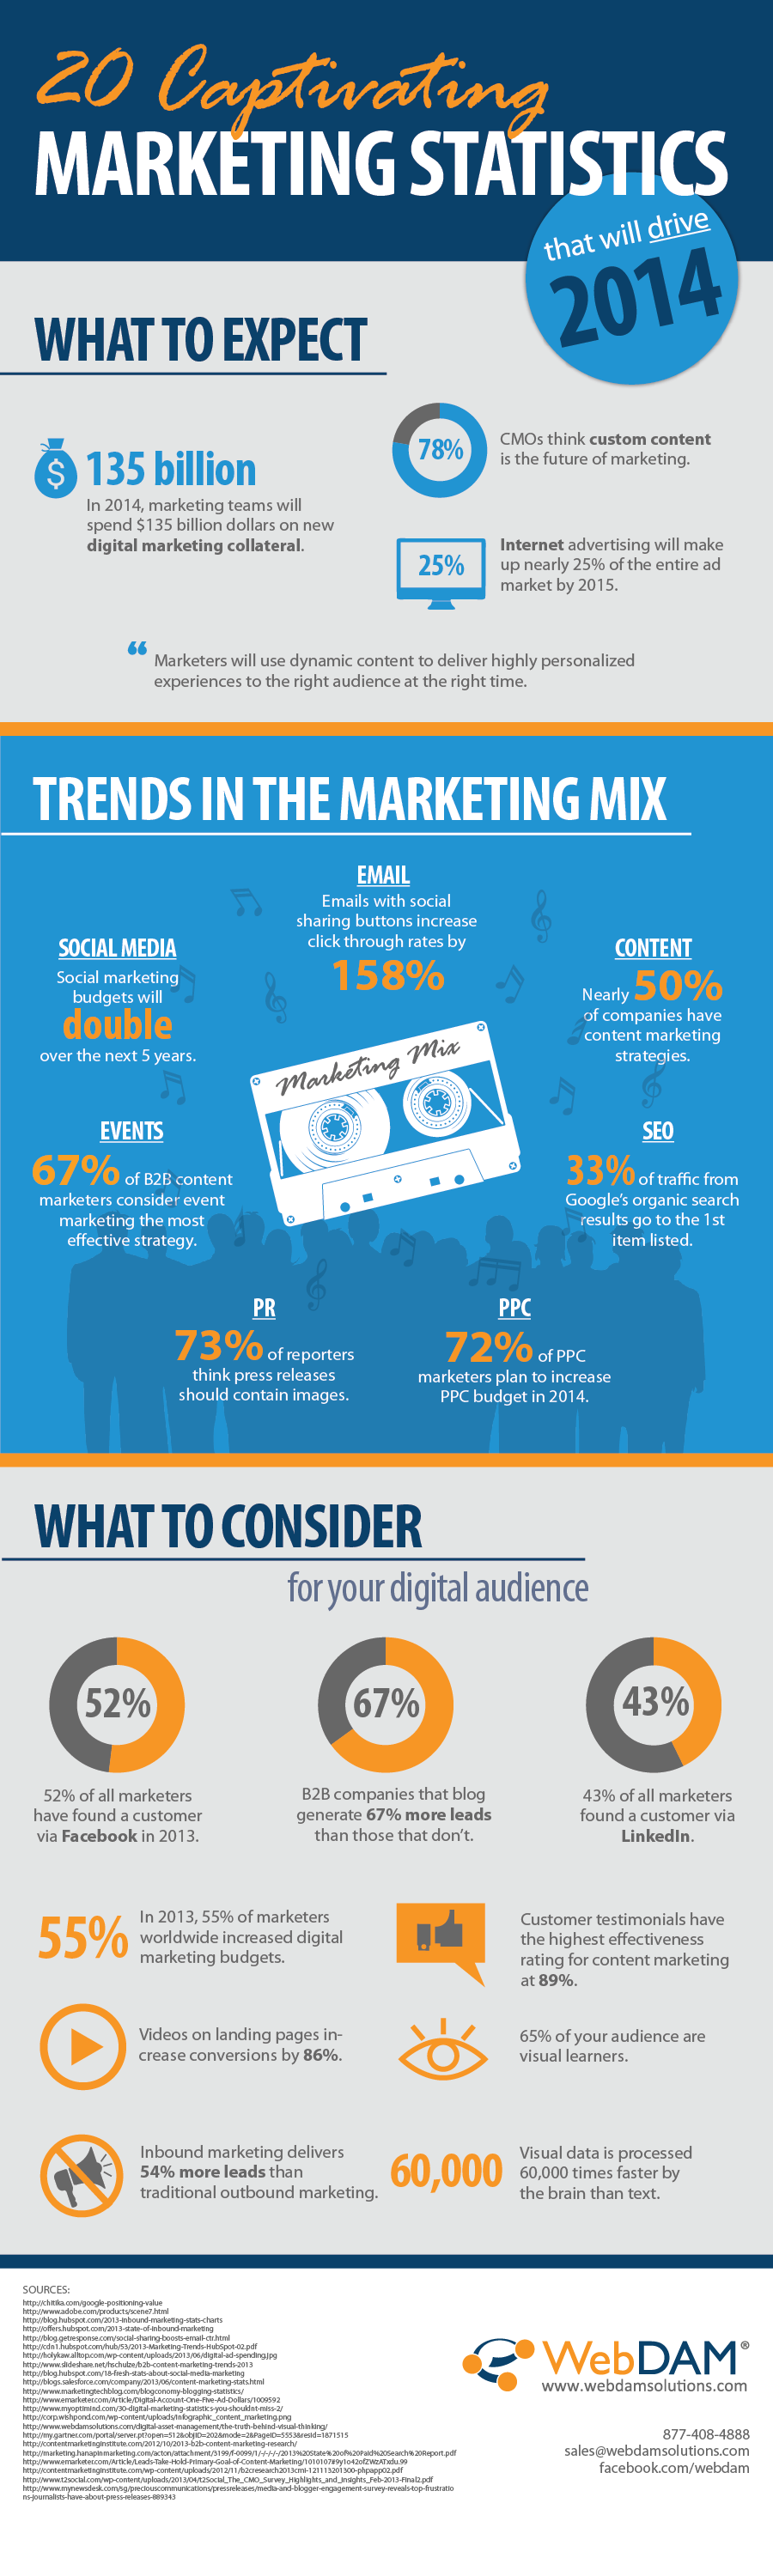
No more sourcing dozens of research papers, reports and websites. The designer of the infographic does all of that for us. Take a look at all the resources this one amazing marketing-metrics infographic (bottom) used in order to provide us with this eye-ball view of marketing metrics. That’s 22 sources. Let’s say they reviewed the page for page of information for just 30 minutes per report or case-study. That is 660 minutes (11 hours) so about 2 – 3 days of research to be fair (people need to eat and take a rest-room break now and again). Then add on the design time of a few days. No wonder a decent infographic piece starts out at about $1,000 per design! Thank god for <i>infographicers</i> ;-). Not only they that, it appears that infographics are everywhere that inbound marketing has a position. Well that’s obvious, since its mostly content driven. But inbound marketers better get their sources in-hand for their infographics which will become the mainstay or evolve into something else..we shall see. In any case take a look at these great Marketing Infographics that have become a great source of information for me to help me make my decisions and plans for the year. I was told they are necessary to become a “thought leader”.
You gotta love marketing, even if it takes itself a little too seriously.
Click on the thumbnails below for a good look:
![]()
![]()
![]()
![]()
This one is in my top 20 best of marketing-stats infographics this year:

